| StockFetcher Forums · General Discussion · Let's Play "The Falling Knife" Game | << 1 ... 2 3 4 5 6 ... 17 >>Post Follow-up |
| karennma 8,057 posts msg #156948 - Ignore karennma |
6/8/2021 10:46:37 AM Back down. Honestly, sometimes I don't want to post anything because I think something will JINX my comment. |
| styliten 345 posts msg #156949 - Ignore styliten |
6/8/2021 5:13:07 PM Looks like a slow recovery: 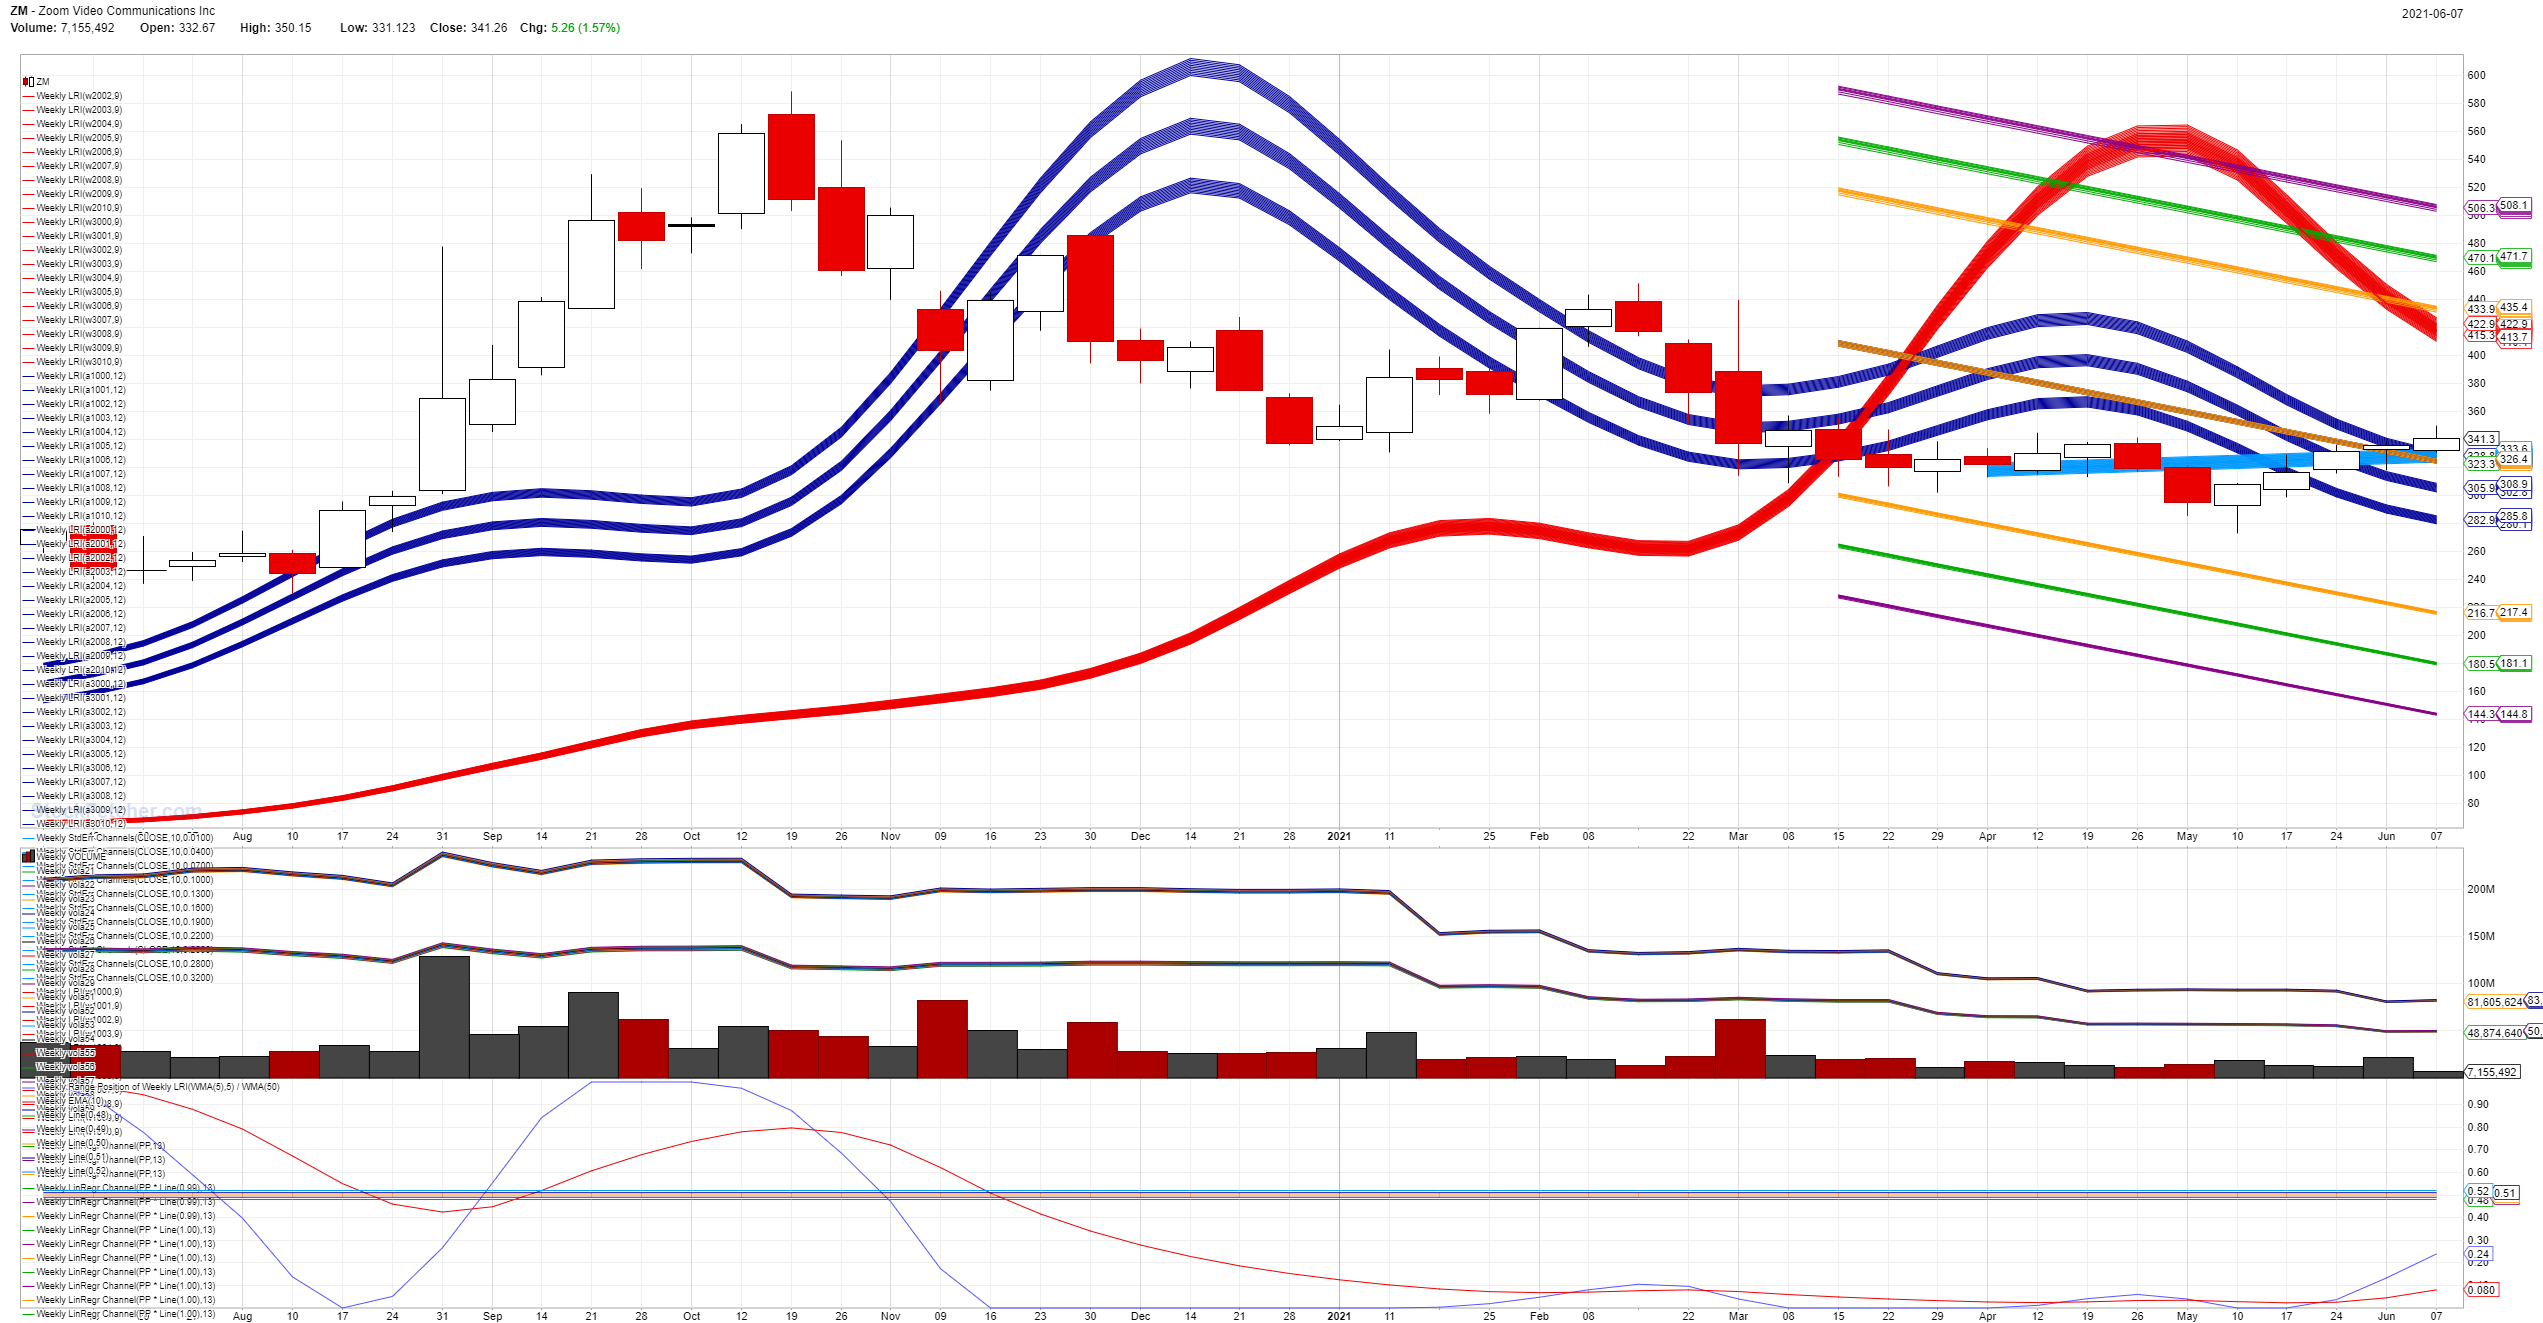 |
| Mactheriverrat 3,178 posts msg #156950 - Ignore Mactheriverrat |
6/9/2021 1:46:00 AM Well ZM is trying to bust through resistance down trend line. Guess we will see what the market has in store for it. 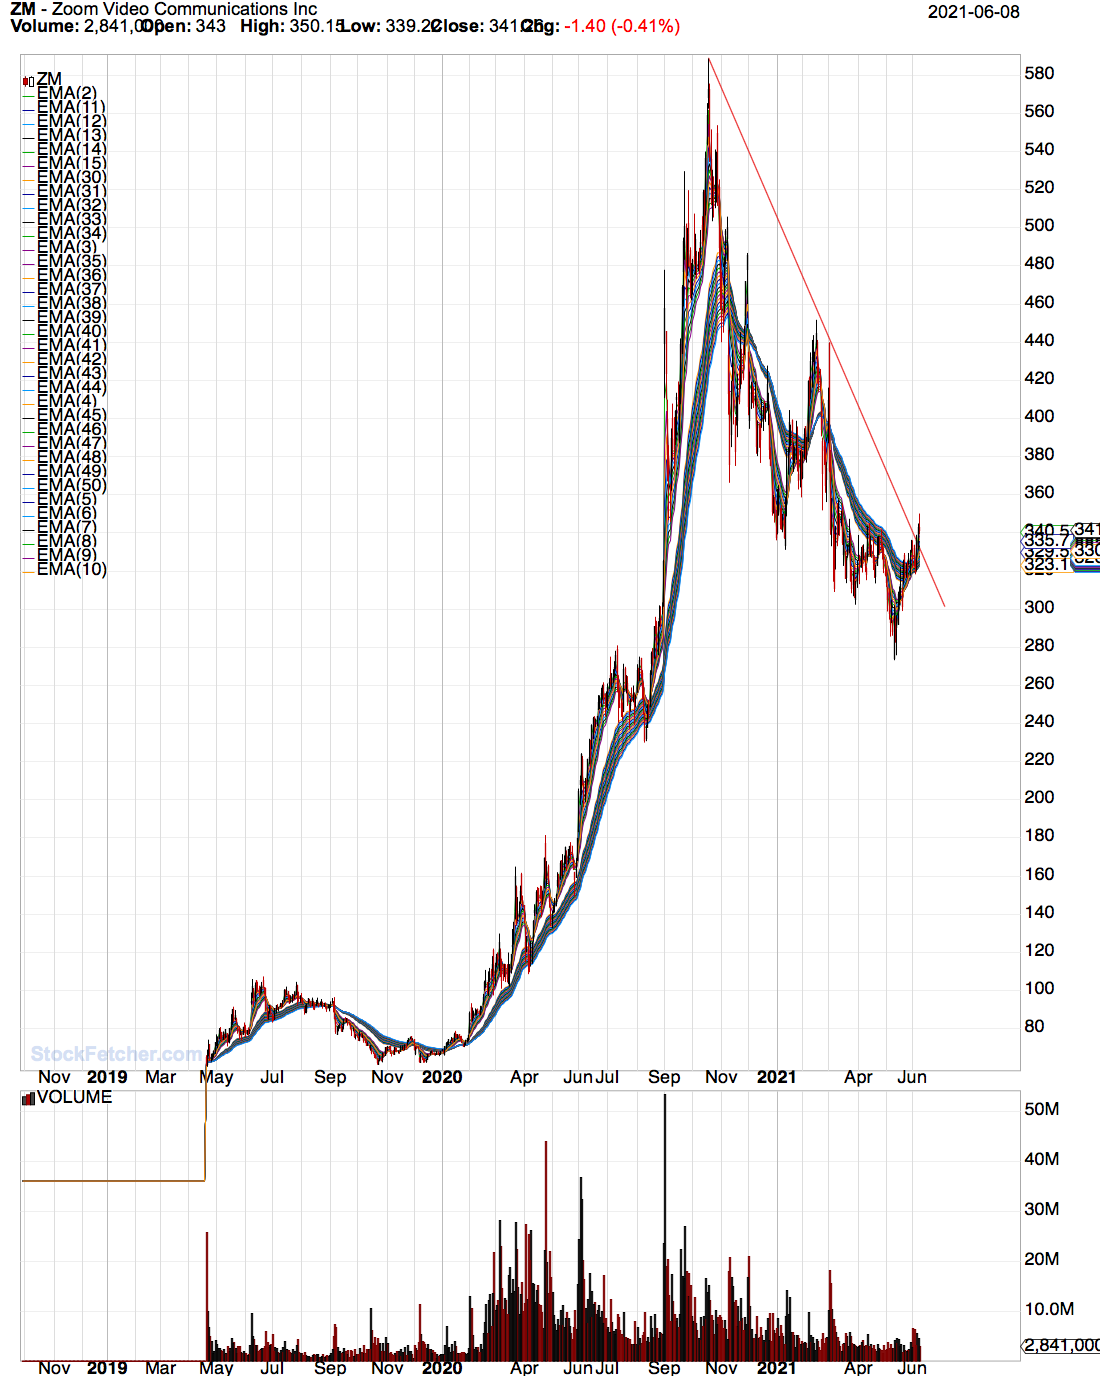 |
| Cheese 1,374 posts msg #156953 - Ignore Cheese |
6/9/2021 11:27:58 AM Here is a clever "Go To" ZM chart by Joseph Kelly. It shows where Support levels become Resistance, and vice versa https://stockcharts.com/public/1993733/chartbook/786677827 |
| Mactheriverrat 3,178 posts msg #156955 - Ignore Mactheriverrat |
6/9/2021 1:59:45 PM Thanks Chesse!!!! |
| Cheese 1,374 posts msg #156959 - Ignore Cheese |
6/10/2021 3:26:32 PM so Mac was right about ZM short-term up trend. Hope it will go to 350 to make karennma happy. |
| Mactheriverrat 3,178 posts msg #156962 - Ignore Mactheriverrat |
6/10/2021 11:36:21 PM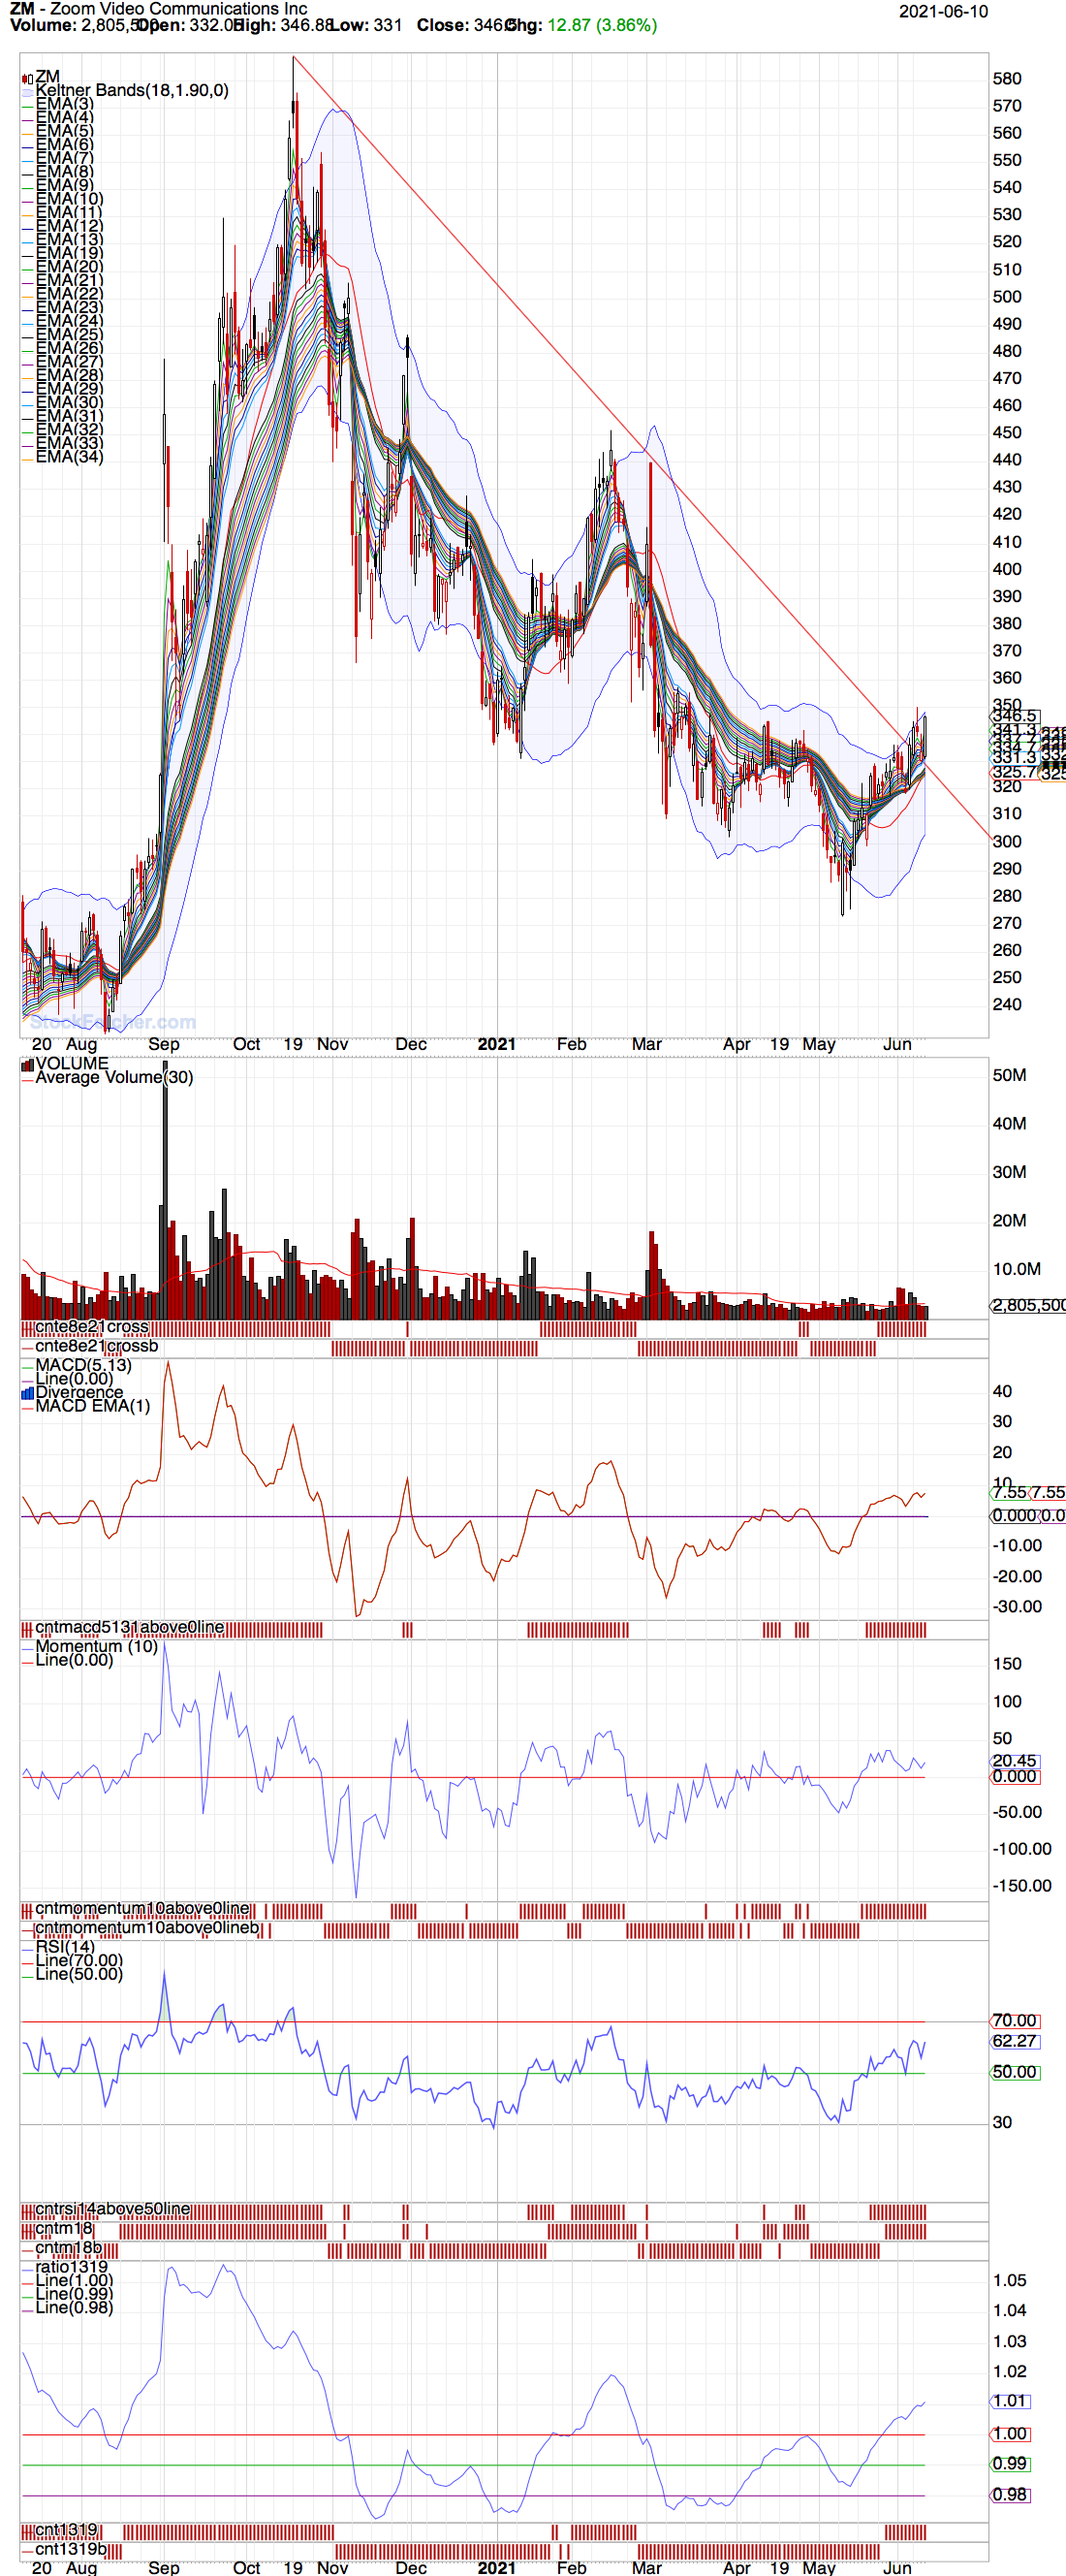 |
| karennma 8,057 posts msg #156964 - Ignore karennma modified |
6/11/2021 8:30:51 AM Crossover confirmed. Can someone look at this chart and explain to me how this person got a "PT" of $1042.50? Nowhere on the chart itself do I see any indication of such a "PT". https://www.tradingview.com/chart/ZM/amMoFEt5-Wyckoff-daily-reaccumulation-on-ZM-PT-1042-50/ Edit: @ Mac, Thanks for the updated chart. |
| nibor100 1,103 posts msg #156967 - Ignore nibor100 |
6/11/2021 10:42:24 AM @ karenma, regarding the TradingView chart, I suspect the PT, I'm assuming Profit Target of $1042 was calculated taking the distance from some recent low to the Oct High and adding it that high to get a maximum PT. Just guessing here, Ed S. |
| karennma 8,057 posts msg #156969 - Ignore karennma |
6/11/2021 12:17:54 PM @nibor, "Profit target" ??? I thought she meant Price Target. |
| StockFetcher Forums · General Discussion · Let's Play "The Falling Knife" Game | << 1 ... 2 3 4 5 6 ... 17 >>Post Follow-up |