| StockFetcher Forums · General Discussion · Let's Play "The Falling Knife" Game | << 1 ... 9 10 11 12 13 ... 17 >>Post Follow-up |
| Mactheriverrat 3,178 posts msg #157725 - Ignore Mactheriverrat modified |
10/1/2021 10:31:51 PM @Karen I was a web version TC2K basic ( Gold) subscriber but I use a Mac. I've been back at stock charts.com for awhile. I may go back in the future. ZM still in down trend. Chart is with T3 average's with a t3-3 crossover/under of t3-13 count , Guppy average's , RSI 14 , and future support line's where ZM may hold. That t3-3 crossover/under of t3-13 count seem to be fairly good at catching change trend change's IMHO. Have a great weekend. Mactheriverrat John BTW- I'm retired from working on the River as of Sept 8th. I'm enjoying it. 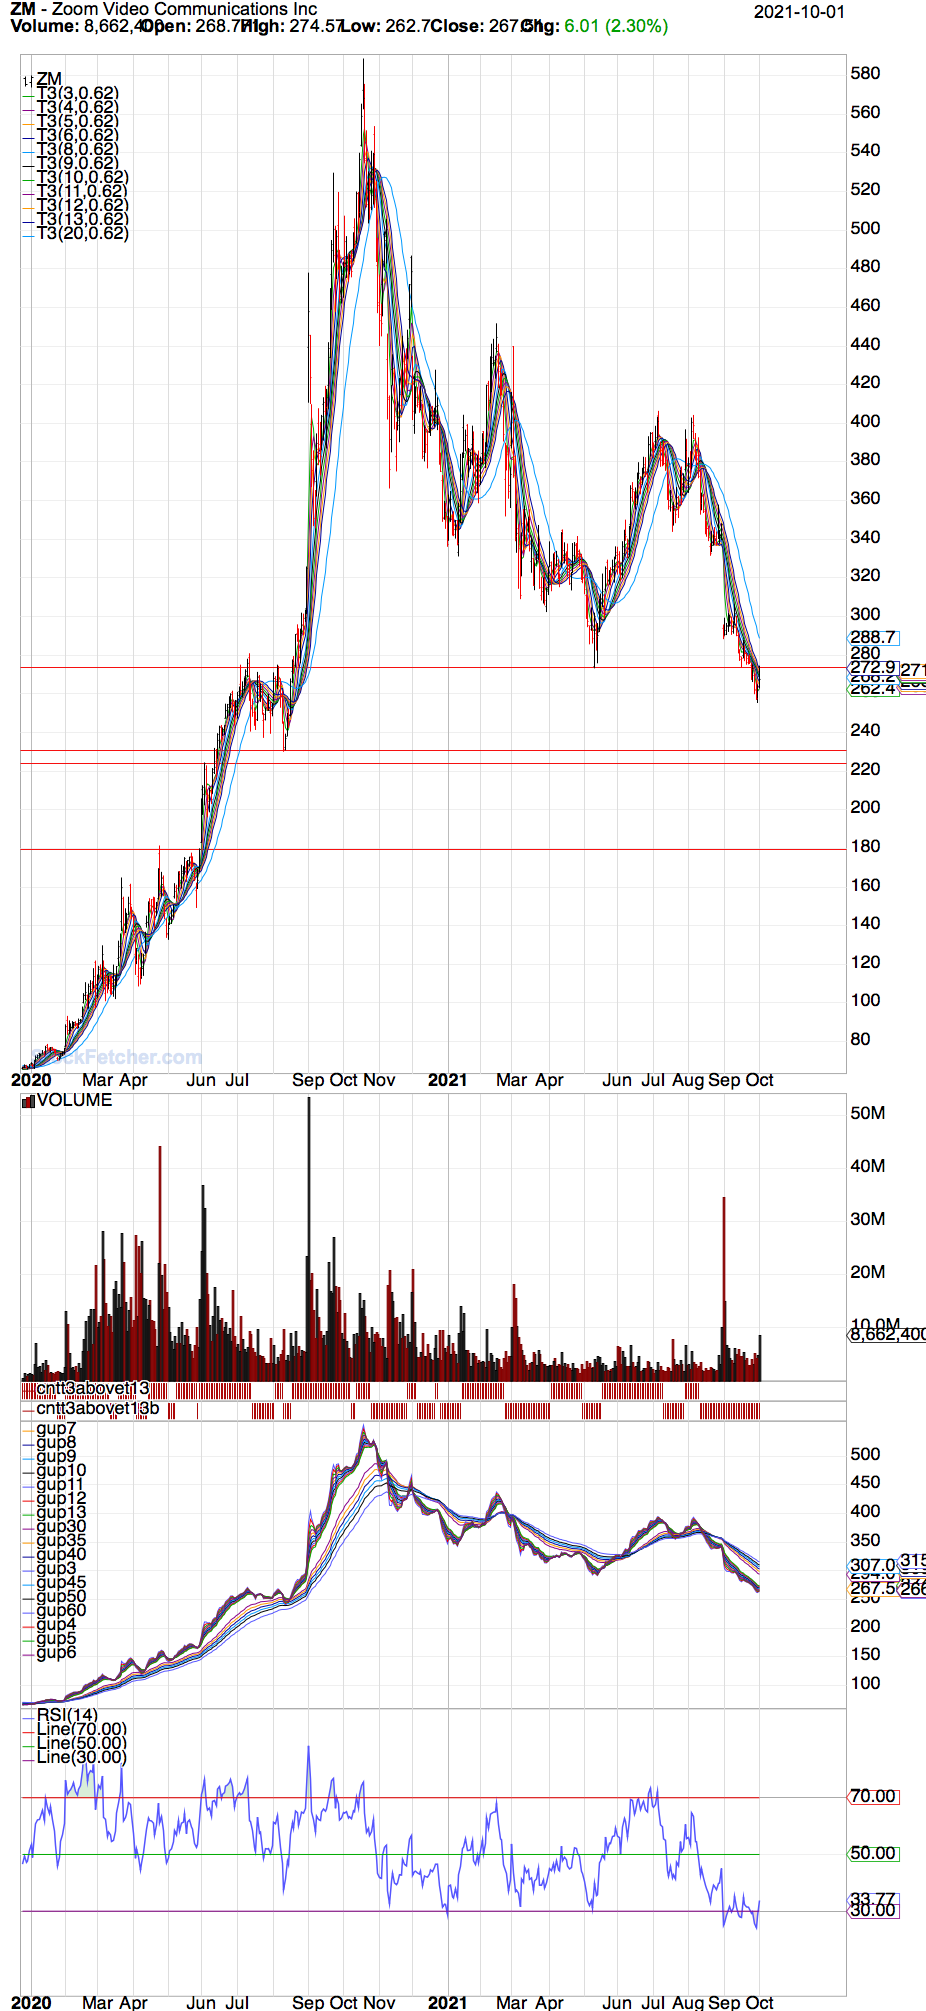 |
| Cheese 1,374 posts msg #157728 - Ignore Cheese |
10/1/2021 10:58:47 PM https://www.stockfetcher.com/forums/General-Discussion/Let-s-Play-The-Falling-Knife-Game/156318/100 ================================================================================== @karennma @Mactheriverrat I am not a TC2K subscriber. Please share some of your seminar notes if you took any, or any link to the seminar if or when it's posted on YouTube. Thanks. |
| Cheese 1,374 posts msg #157730 - Ignore Cheese |
10/2/2021 12:23:21 AM https://www.stockfetcher.com/forums/General-Discussion/Let-s-Play-The-Falling-Knife-Game/156318/100 Mactheriverrat John BTW- I'm retired from working on the River as of Sept 8th. I'm enjoying it. ================================================================================ Happy retirement, John. Double blessing to retire healthy and wealthy. |
| karennma 8,057 posts msg #157733 - Ignore karennma |
10/2/2021 6:45:45 AM @ Mac, CONGRATS on your retirement! Hope you've got lots of hobbies. LOL! |
| karennma 8,057 posts msg #157734 - Ignore karennma |
10/2/2021 7:11:22 AM @ Cheese, re: "Please share some of your seminar notes if you took any, or any link to the seminar if or when it's posted on YouTube." ============================================== Mr. Worden and the lead instructor gave the seminar. No BS -- only 30 minutes. These guys don't play and get right to the point. It's a scanner function. So, you should have the software to see the graphs. Anyway, the scanner finds the % of stocks from various watchlists that are above and below the 50 and 200-day simple moving average. The results (%) appear on a graph that can be displayed in multiple time frames. I realize you can do a similar sort on SF (show stocks above or below etc ...) , but I don't think the % can be automatically calculated, which made the scan so good. You can scroll thru any time frame and it's like having a crystal ball. (Tee hee .. well sort of.) If TC2K has a Youtube channel, you should definitely look out for that video. |
| snappyfrog 751 posts msg #157735 - Ignore snappyfrog |
10/2/2021 8:12:16 AM Mactheriverrat BTW- I'm retired from working on the River as of Sept 8th. I'm enjoying it. *********** Congratulations on retirement. Enjoy it to the fullest! |
| Cheese 1,374 posts msg #157739 - Ignore Cheese |
10/2/2021 1:43:04 PM https://www.stockfetcher.com/forums/General-Discussion/Let-s-Play-The-Falling-Knife-Game/156318/110 karennma 10/2/2021 7:11:22 AM the scanner finds the % of stocks from various watchlists that are above and below the 50 and 200-day simple moving average.The results (%) appear on a graph that can be displayed in multiple time frames. I realize you can do a similar sort on SF (show stocks above or below etc ...) , but I don't think the % can be automatically calculated, which made the scan so good. You can scroll thru any time frame and it's like having a crystal ball. =================================================================================== karennma THANK YOU for the idea ! |
| Mactheriverrat 3,178 posts msg #157741 - Ignore Mactheriverrat modified |
10/2/2021 2:03:55 PM @ Karen Thank you! No hobbies yet maybe grow a small garden next spring. Love working outside in the yard. Just being home is great . No more traveling from Little Rock, AR to St Louis, MO or back every 28 days. @snappyfrog Thank you very much!! I think I'm going to enjoy it very much!!!! The last picture of my Boat at the St paul, MN city front. I will miss her and the crew that I rode with. Good people!!! 
|
| karennma 8,057 posts msg #157742 - Ignore karennma |
10/2/2021 2:31:28 PM @Mac, Wow! What a life! |
| Mactheriverrat 3,178 posts msg #157743 - Ignore Mactheriverrat |
10/2/2021 3:12:54 PM A video of her taken about 5 year's ago. |
| StockFetcher Forums · General Discussion · Let's Play "The Falling Knife" Game | << 1 ... 9 10 11 12 13 ... 17 >>Post Follow-up |