| StockFetcher Forums · General Discussion · Code | << 1 2 >>Post Follow-up |
| Mactheriverrat 3,178 posts msg #141186 - Ignore Mactheriverrat modified |
1/19/2018 11:31:04 PM Using the below code. I'm trying to search for code that will give in a column of first date of crossover. set{E3,dma(8,-5),8)-cma(DMA(8,-5),8) } set{Longposition, count(E3 > 0,1)} set{Shortposition, count(E3 < 0,1)} SET{TRIGGER,0} draw Longposition on plot draw Shortposition on plot draw dma(8,-5),8) draw cma(DMA(8,-5),8) -------------------------------------- This is what I've been playing with no luck /* LONGSHORT is number of consecutive days Longposition above (+)/below(-) previous Shortposition */ set{LONGSHORTb,days( Longposition is above Shortposition ,250)} set{LONGSHORTa,days( Longposition is below Shortposition ,250)} set{LONGxSHORT, LONGSHORTa - LONGSHORTb} and add column LONGxSHORT {LONG_x_SHORT} |
| davesaint86 726 posts msg #141204 - Ignore davesaint86 modified |
1/20/2018 5:55:06 PM I sent the filter to SF support but they sent me the same thing back (your revision). I'm talking about where XIV technically was not a sell on Jan 12th. I do not have an answer to this post. It would be nice. |
| Mactheriverrat 3,178 posts msg #141209 - Ignore Mactheriverrat |
1/20/2018 8:26:05 PM Using the dma(8,-5),8) crossover cma(DMA(8,-5),8) on XIV shows for short term correction only. which IMHO is a week to 2 weeks but it can also get you out of a trade if the short term correction turns into a major correction. 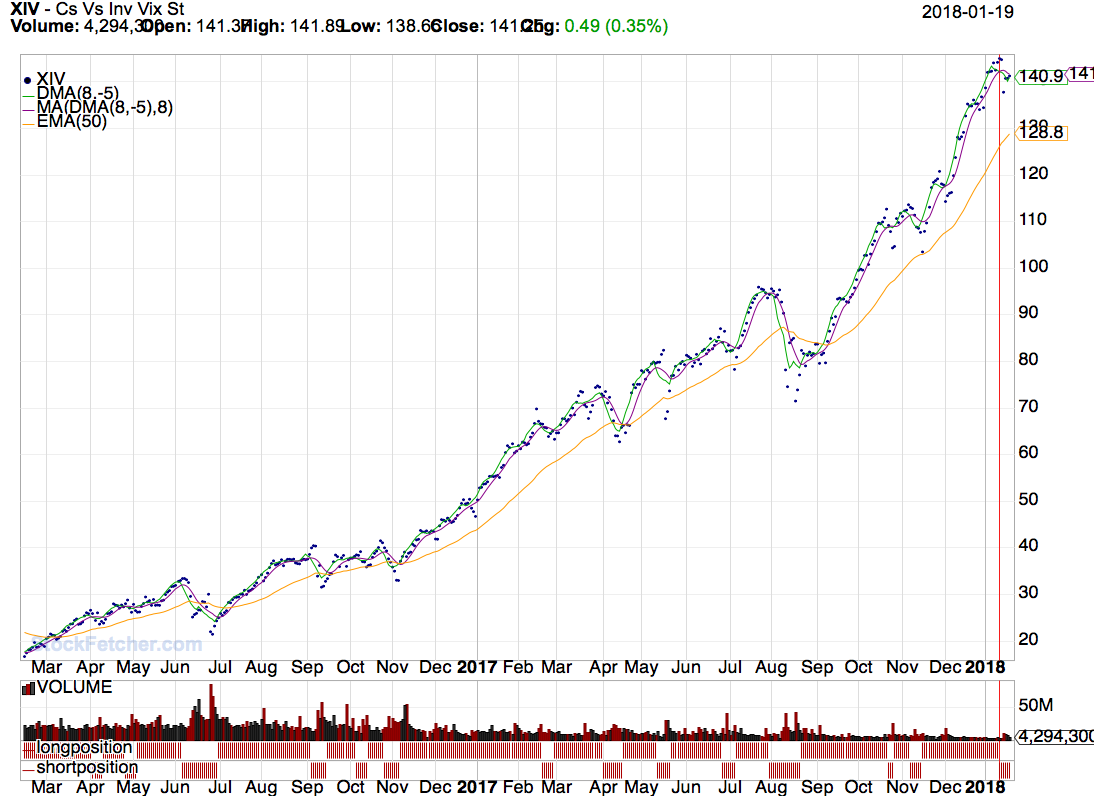 |
| Mactheriverrat 3,178 posts msg #141213 - Ignore Mactheriverrat |
1/20/2018 8:59:40 PM I'm waiting to see if FOUR and his big bag of code tricks can do something with this. |
| four 5,087 posts msg #141216 - Ignore four |
1/20/2018 11:29:58 PM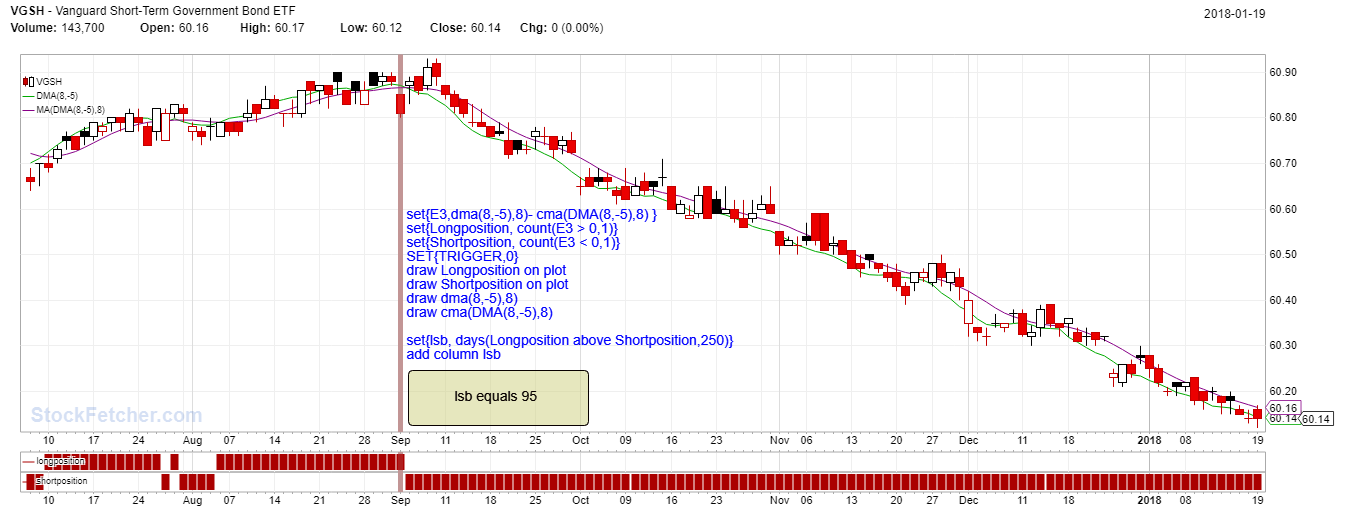 |
| davesaint86 726 posts msg #141220 - Ignore davesaint86 |
1/21/2018 8:38:15 AM Thanks Four - I added the lsb piece and looked at XIV. I was concerned about January 11. The lsb number return on this date is 0. I noticed on other false signals this only happens when the crossover lines are sitting on top of each other. Once they separate the signals are clear. |
| four 5,087 posts msg #141223 - Ignore four |
1/21/2018 12:27:13 PM welcome |
| graftonian 1,089 posts msg #141224 - Ignore graftonian |
1/21/2018 12:37:23 PM I'm confused, how does one move a moving average back in time when it has not yet been created? |
| four 5,087 posts msg #141227 - Ignore four modified |
1/21/2018 1:53:24 PM https://www.forexfactory.com/attachment.php/1926073?attachmentid=1926073&d=1463019368 Displaced Moving Averages. Page 39: The displacement is on the time axis, not the price axis. For the visual learners among you, the arrow in the following chart shows that the same Moving Average is simply placed forward in time. Author: Joe DiNapoli Text: Trading with DiNapoli Levels -- http://stockcharts.com/articles/mailbag/2015/01/how-can-i-shift-moving-averages-forwards-and-backwards-wvideo.html How Can I Shift Moving Averages Forwards and Backwards? (w/video) Arthur Hill | January 30, 2015 at 05:00 AM |
| Mactheriverrat 3,178 posts msg #141228 - Ignore Mactheriverrat modified |
1/21/2018 2:28:18 PM Thanks FOUR :-) Very Interesting links! |
| StockFetcher Forums · General Discussion · Code | << 1 2 >>Post Follow-up |